

Current state
my.metacentrum.cz, your starting point for everyday work
A standalone web application that replaced PBSmon. It shows the most important information about your jobs, the queues and the available computing resources in one place.

What you will find in my.metacentrum.cz
Your jobs
- Running, queued and completed jobs
- How your jobs use the allocated resources
- How each job runs and progresses
Computing resources
- Clusters and their specifications
- Queues, GPUs and specialised resources
- State of the infrastructure
- Storage systems and disk quotas
- Cloud projects
Qsub Assembler
A graphical wizard that builds the qsub command for you, especially handy for new users. It also shows which machines match your requirements and how busy they are right now.
Live dashboard
Available and used CPUs and GPUs and the number of running and queued jobs on the PBS servers, right now. The panels update automatically.
MetaCentrum PBS server (pbs-m1.metacentrum.cz)
Array jobs are not included in the numbers of running and queued jobs.
ELIXIR PBS server
Array jobs are not included in the numbers of running and queued jobs.
Usage statistics
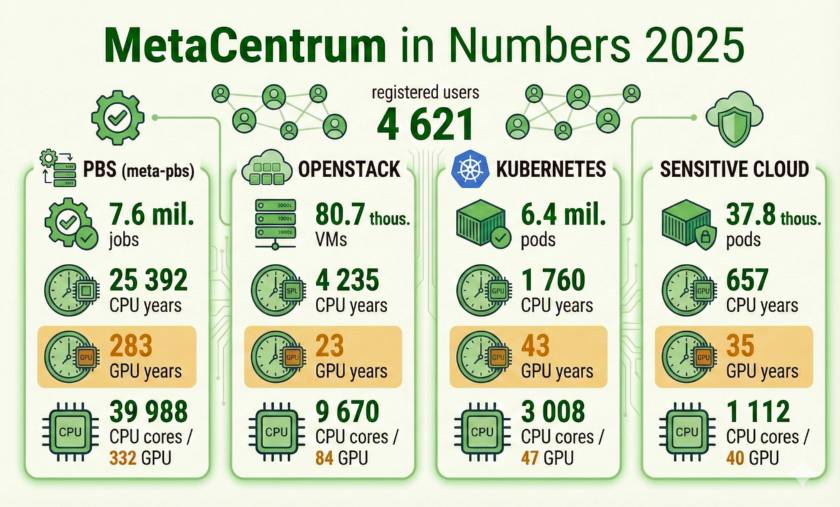
Every year we publish the operating statistics of MetaCentrum: the computed time and the number of jobs on the machines integrated into MetaCentrum, waiting times and job runtimes, the institutions involved, the applications used, the most active users, machine utilisation and how institutions use the open-access clusters.
Statistics for 2025The annual reports are published in Czech.
How the statistics are calculated
Terminology
Application statistics
The statistics of the applications used come from the Linux kernel accounting records of processes. All processes on all MetaCentrum machines that last longer than one second are recorded. For each process we know the name of the executed file (without its path) and other data, specifically utime , stime and etime (user time, system time and elapsed time).
The names of the executed files are compared with regular expressions that capture the file names of known applications. For example, every process matching this regular expression is counted under the Amber application:
ptraj|pmemd.*|_pmemd.*|_sander.*|sander.*|teLeap|xaLeap|mm_pbsa.pl|pbsa|nmode|mopac|pmtree_.*|alltoall|analysis|normalization
The utime and stime of all processes of each application are then added up, so the statistics show the time actually consumed by calculations.
Machine utilisation
Utilisation is calculated for each cluster separately, because MetaCentrum consists of diverse machines that belong to different organisations. Some machines and clusters are fully reserved for their owners, so totals for the whole of MetaCentrum would be misleading.
The data come from the job logs of the PBS scheduling system. Processors assigned to a job count as fully used from the start to the end of the job. The statistics therefore show the time allocated to users, not how effectively the users use that time.
Utilisation is calculated for each day separately. The number of CPUs in a cluster at the start of the day is the baseline; a change in the number of CPUs shows the following day. The number of CPUs multiplied by the seconds in the day (usually 86,400, except on the days when daylight saving time starts or ends) gives the reference number of CPU-seconds for that cluster and day. Every CPU-second falls into one of these states: