
Pozn.: V závorce jsou pro srovnání údaje za 1. pololetí roku 2011.
During the considered period, the number of CPUs available in MetaCentrum has increased significantly, especially thanks to the support of CESNET and CERIT-SC Operational Programme Research, Development and Innovation projects. Today, MetaCentrum consists of 23 clusters (including frontend nodes) that together comprise 4,996 CPUs. This represents major extension
of MetaCentrum as in the fall of 2011 there were only 2,028 CPUs in the whole MetaCentrum as can be seen in Table 1 that shows the evolution of MetaCentrum w.r.t. available CPUs1.
From this point of view, the new clusters zewura (1,600 CPUs), mandos (896 CPUs) and minos (588 CPUs) represent the largest contribution to the increased size of MetaCentrum. Zewura cluster was made operational on 23 December 2011, while mandos and minos became operational on 13 February and 26 March 2012, respectively.
Figure 1 shows the mean utilization of MetaCentrum resources. Utilization between 60–90 % is considered as reasonable. Higher utilization signals that the resources are fully saturated which may degrade the performance for users as their jobs are experiencing long wait times. On the other hand, low utilization (bellow 60 %) is typical for clusters that are owned and primarily
used by different institutions. Here, only a limited subset of all queues is typically allowed such as in case of luna, loslab, orca or quark cluster. Low utilization is also visible for old machines (skirit49–84) or for machines that were out of service for a long time (alela). The minos cluster has been available since April and it was partially dedicated for virtualization tests, therefore its
utilization is bellow the average utilization of MetaCentrum.
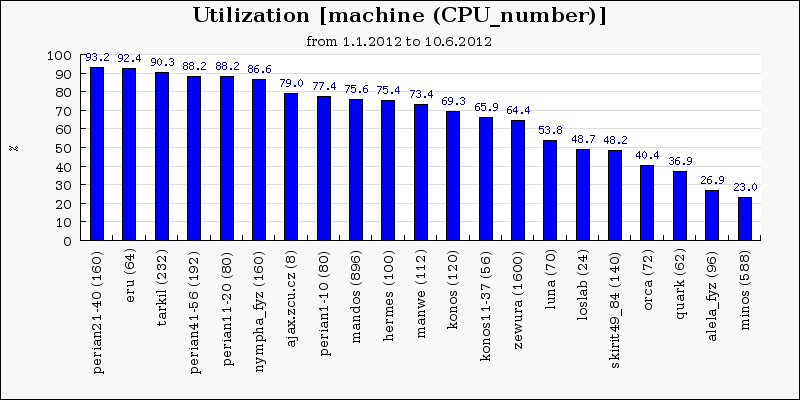
Figure 1: The mean utilization of MetaCentrum resources.
In the considered time period (1 January - 10 June 2012) 360,701 jobs completed in the MetaCentrum system. There were 260 active users in this period. Together, the users and their jobs utilized 8 millions CPU hours, i.e., nearly 914 CPU years. Table 2 represents the comparison with previous years. While the number of jobs is quite similar to previous years, the amount of utilized CPU hours is significantly larger.
The reason is twofolds. First of all, new large clusters such as Zewura, Mandos and Minos significantly increased the available CPU power of MetaCentrum. Secondly, the proportion of parallel jobs has also increased significantly since 2011. For example, jobs requiring more than 16 CPUs were rather unusual in the past year while during this year they represent significant proportion of all jobs. This indicates that the users are able to utilize new large clusters. Moreover, since 2011 the average job runtime has increased by 88 minutes (336 vs. 425 minutes).
| period | number of jobs in thousands | CPU hours |
| 2010/1-6 | 280 | 3,0 mil. |
| 2010/7-11 | 400 | 3.2 mil. |
| 2011/1-6 | 286 | 3.0 mil. |
| 2011/7-11 | 323 | 3.6 mil. |
| 2012/1-6 | 361 | 8.0 mil. |
Table 2: The number of completed jobs and the amount of used CPU hours.
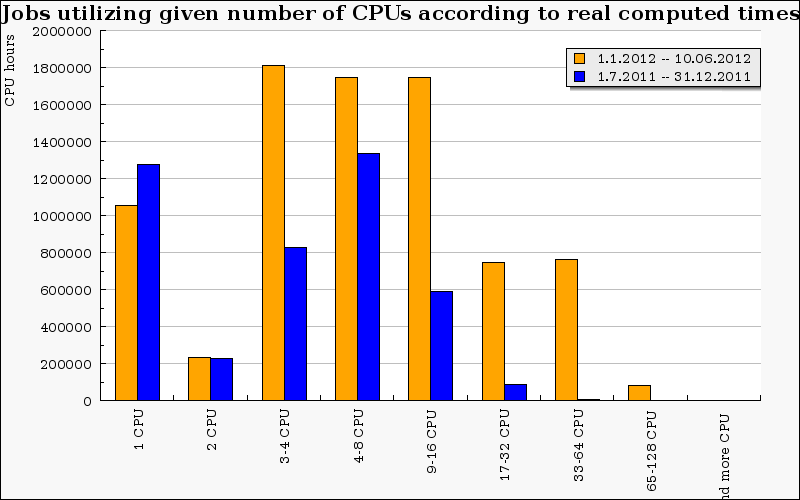
Figure 2: The distribution of consumed CPU hours according to the job parallelism.
Figure 3 shows the distribution of job arrivals and completions (top) and the amount of
consumed CPU hours per day in the considered time period. Although there was a significant
peak of users’ activity lasting for approximately one month (since the second half of March) it
does not have some significant effect on the average amount of used CPU hours, that are rather
stable during the whole period.
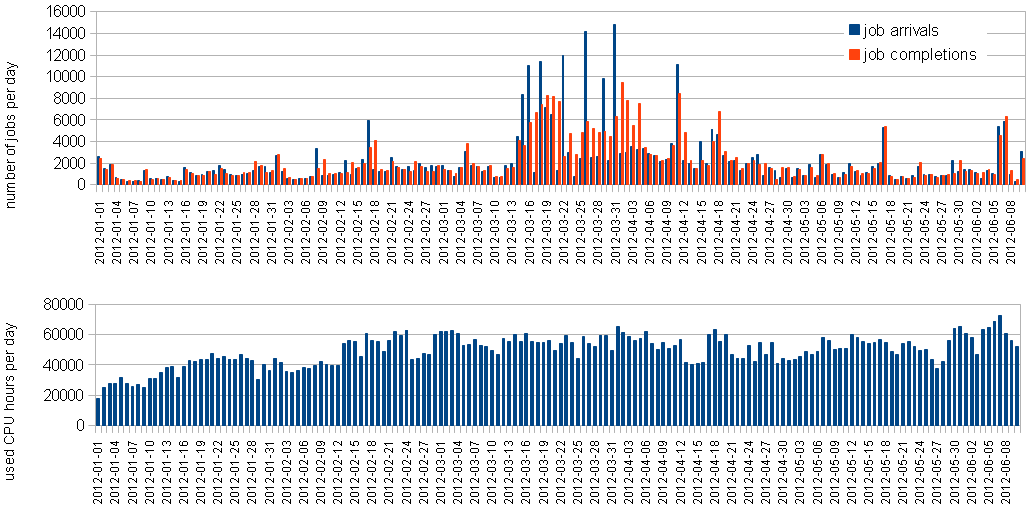
Figure 3: The distribution of job arrivals and completions (top) and the amount of consumed CPU hours (bottom) during the first half of the year 2012.
Figure 4 shows how the (first) users’ activity was distributed in the considered time interval. Strictly speaking, it shows when a given user used the MetaCentrum for the first time in this year. Naturally, there is a significant peak at the beginning caused by stable users who use MetaCentrum regularly. Still, new users appear frequently during the whole period. Together, 260 active users have been identified in the first half of the year 2012. In the same period in 2011, there were only 206 users3.

Figure 4: The distribution of first user activity during the first half of the year 2012.
In this section we present the utilization of selected clusters. We start with the two new SMP clusters (mandos and zewura) then continue with the popular perian41-56, eru and tarkil clusters.
Next we show the utilization of the konos cluster that is used for GPU computing using CUDA. Finally, the low utilization of dedicated clusters such as quark and orca is presented. These figures show several interesting results. Zewura and mandos (Figures 5–6) are both SMP clusters with large machines (64–80 CPUs per machine). Here the utilization can hardly reach 100 % as the shared memory is often fully used by memory demanding jobs. At such situation, several CPUs may remain idle since the machine’s RAM is fully utilized. On the other hand, “smaller" clusters such as perian41-56, eru or tarkil do not deal with such a problems very often as the average size of one machine within the cluster is smaller (8–32 CPUs). Therefore, the CPUs are often highly utilized as can be seen in Figures 7–9. A very low utilization can be seen when the cluster is primarily dedicated to a given institution or some privileged user as is the case of, e.g., quark or orca cluster (see Figures 11–12).
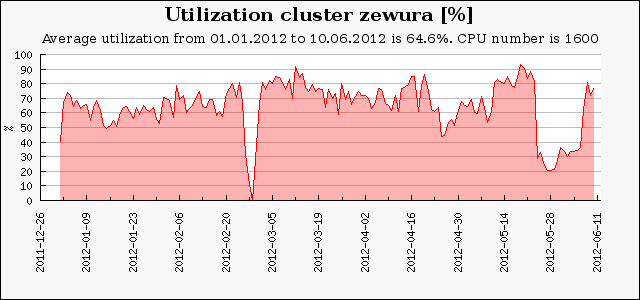
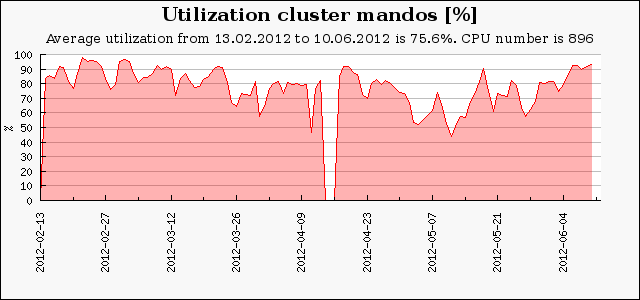
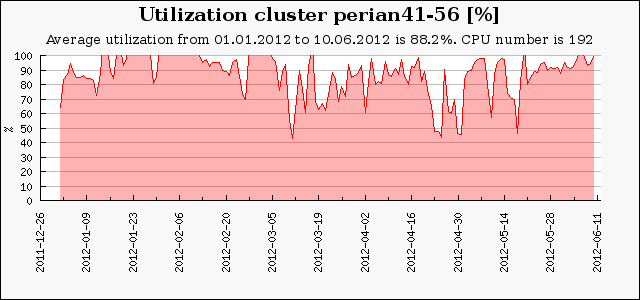
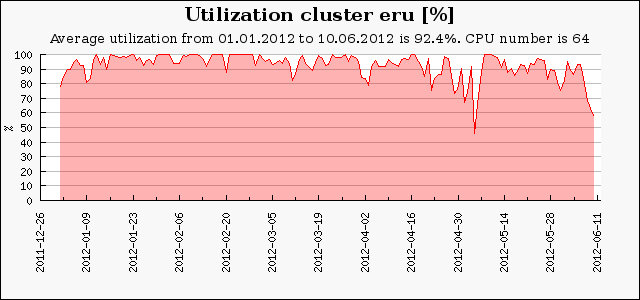
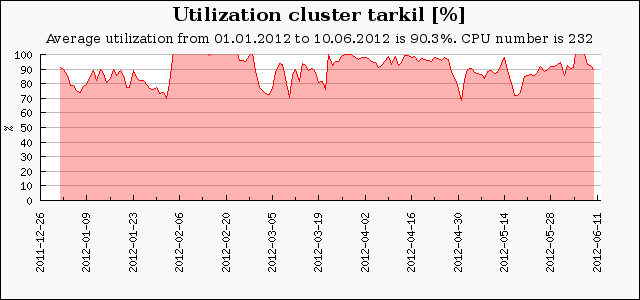
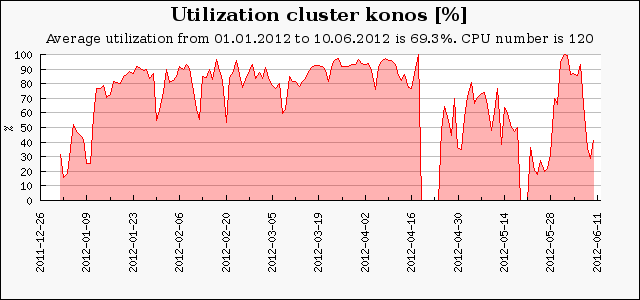
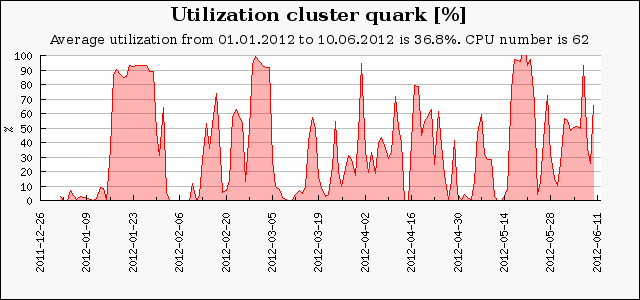
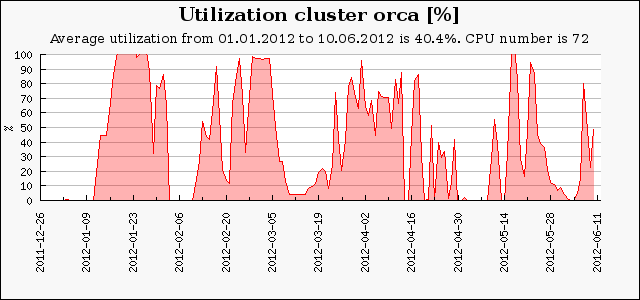
Figure 5-12: The average utilization of seected clusters.
Graphs in Figs. 13 and 14 illustrate quantitative differences of number of submitted jobs and consumed CPU time among users. The top 15 users consumed together nearly 50 % of the total CPU time.
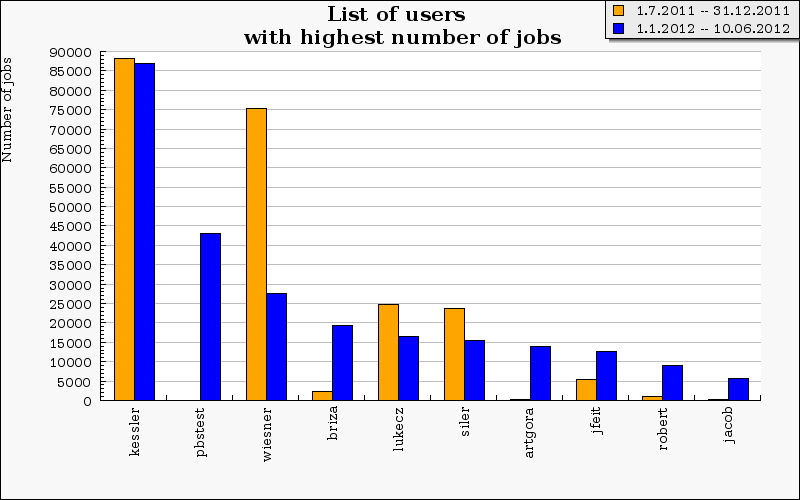
Figure 13: TOP 15 users with the highest number of jobs.
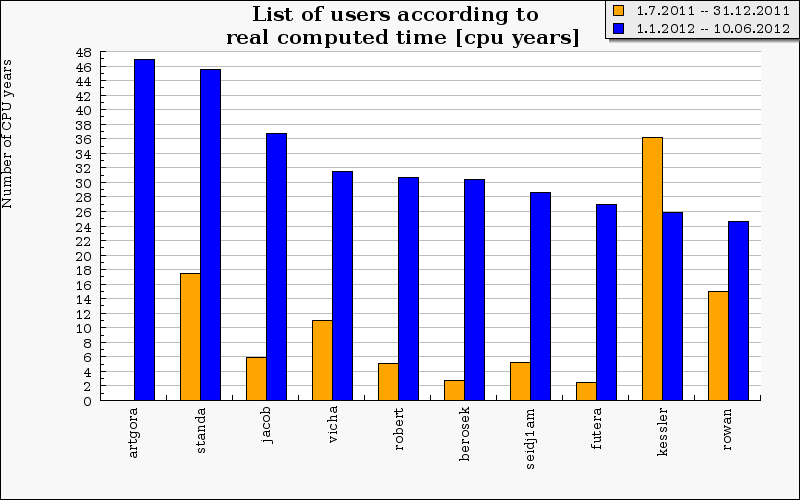
Figure 14: TOP 15 users with the highest computed time.
More detailed preview of computed time using by institutions is shown at Fig. 15. The most active users (according to consumed CPU time) are at the CEITEC (32 % of whole CPU time) Masaryk University (22 %), Charles University (21 %) and Academy of Sciences (13 %).
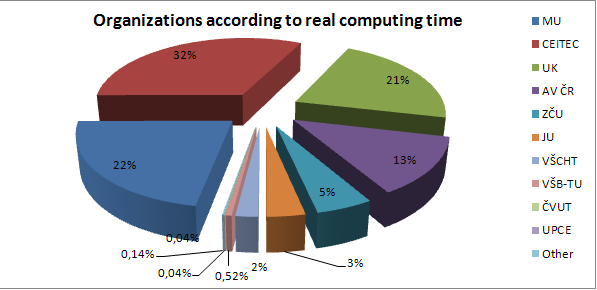
Figure 15: Organizations according to real computed time.
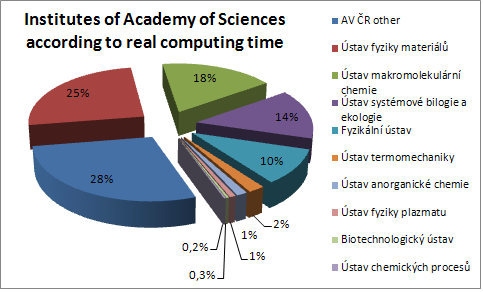
Figure 16: Institutes of Academy Sciences according to real computed time.
The applications consuming most of CPU time are shown in Fig. 17. The “Others" column represents sum of application with smaller usage, undistinguished home-grown user scripts and applications.
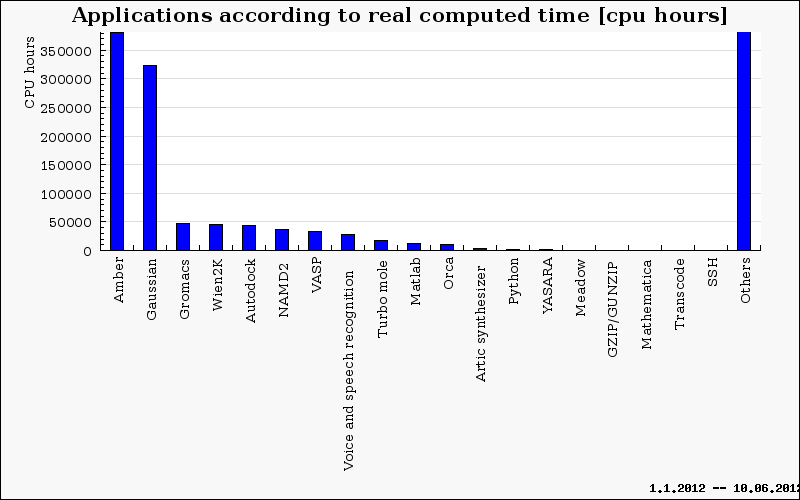
Figure 17: Applications according to real computed time.